
Documentation menu
Overview
The Overview is the first page NetworkTuna shows. It sums up whether anything needs your attention, how much traffic this PC has right now, what the router checks found and how this computer is protected. To open it, choose Overview in the sidebar.
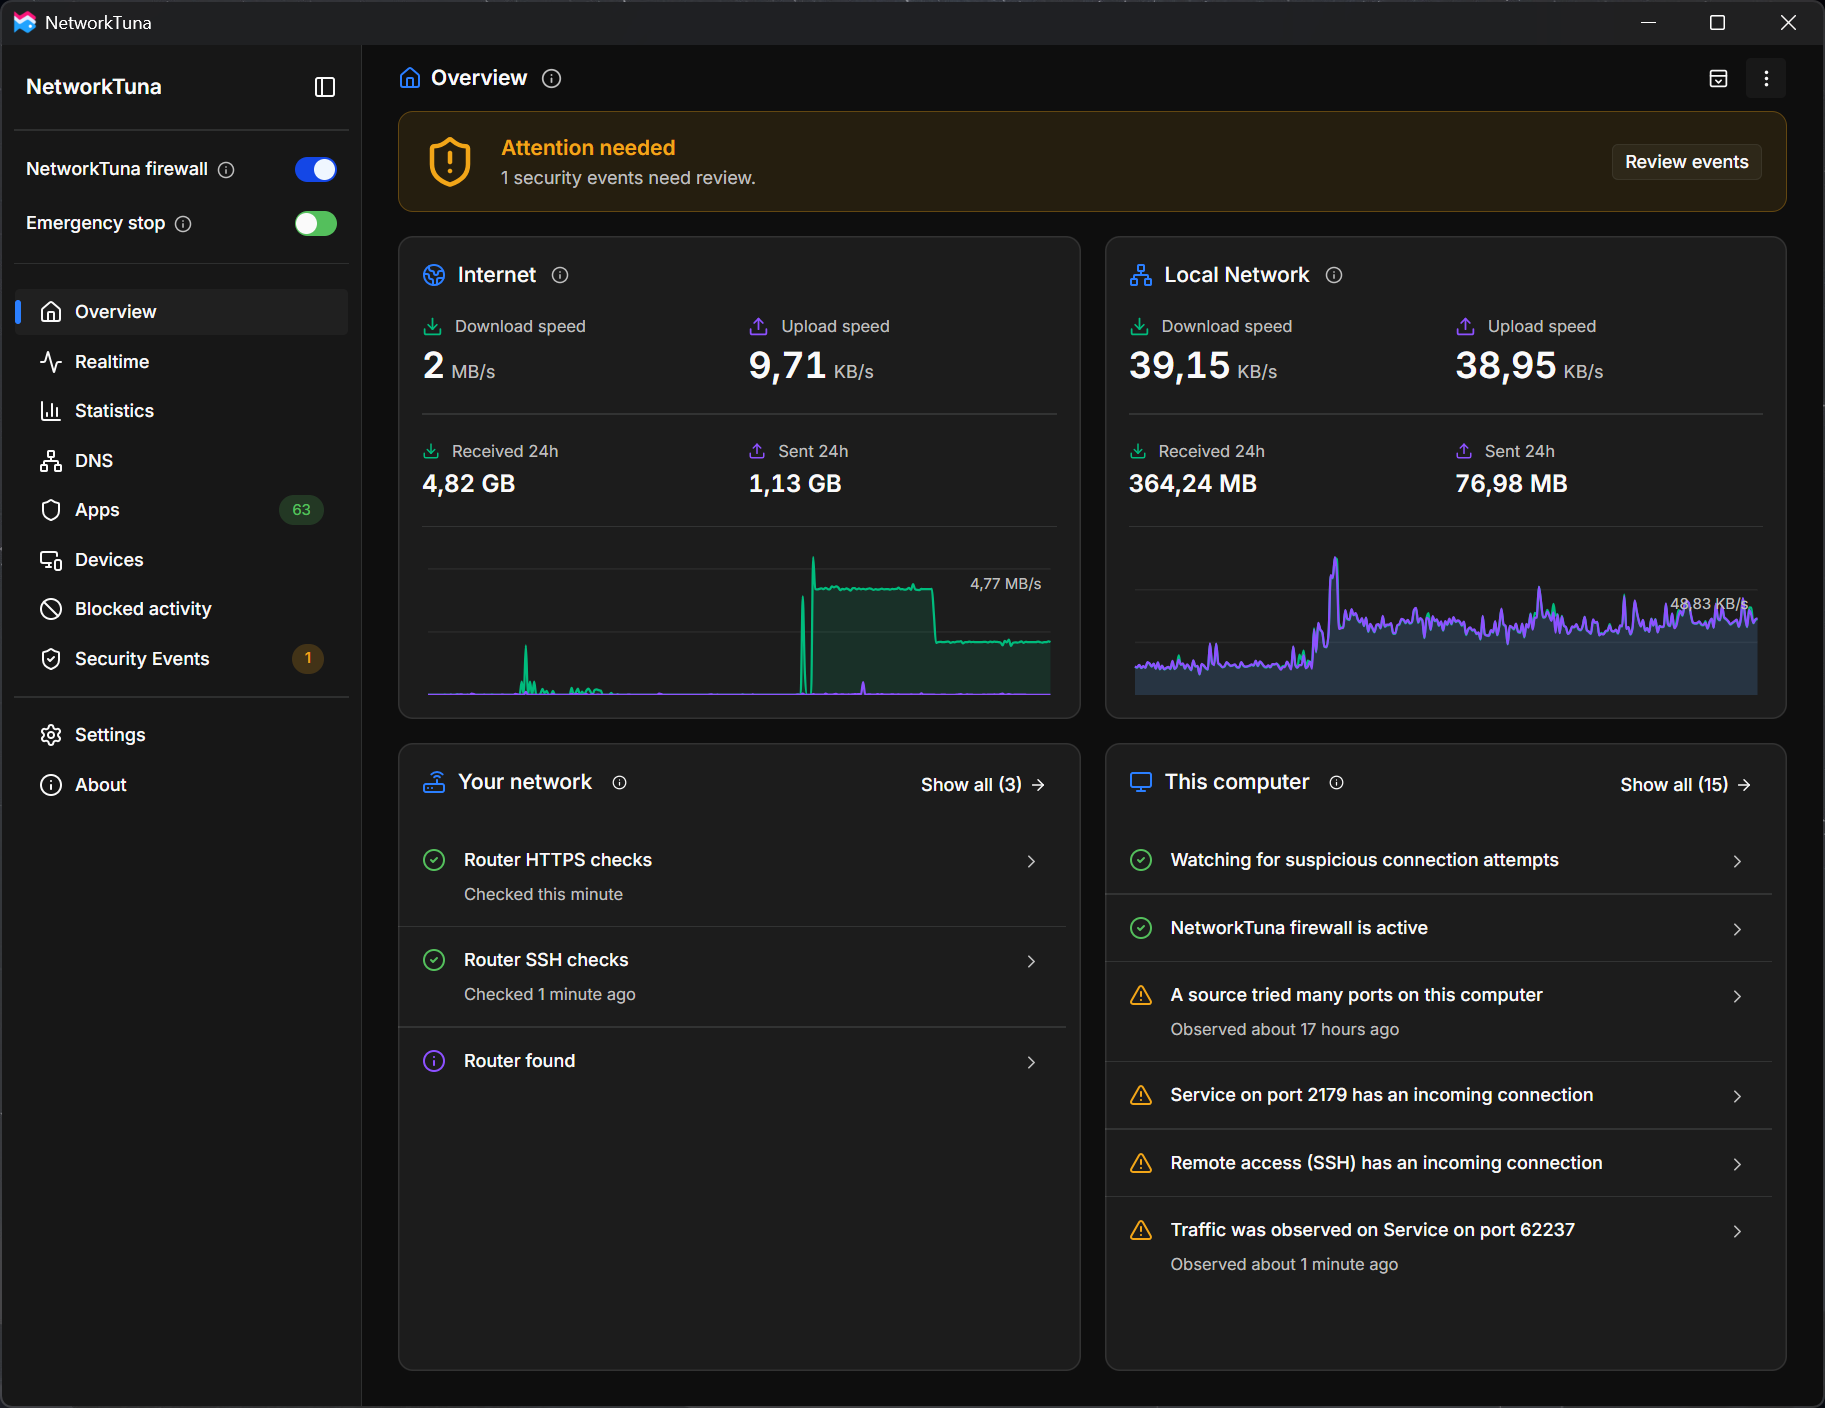
The Overview only shows what NetworkTuna knows. Opening it never turns on a check, accepts a router key or marks an event as reviewed. Each part leads to the page that explains it in detail.
Status banner
The banner at the top says whether anything needs your attention:
| Banner | When |
|---|---|
| No security alerts need review (green) | No warnings or alerts wait for review, and the NetworkTuna firewall is on. |
| Attention needed (amber) | Security events with warnings wait for review, apps wait for a firewall decision, or the NetworkTuna firewall is off or all traffic is stopped. |
| Security alert on your network (red) | A high-level security event waits for review. |
| Checking protection status | NetworkTuna is still reading the current state. |
The text below the title says what needs attention. Review events opens the Security Events page, and Review requests opens the pending connection requests. See How serious an event is for the levels.
Internet and Local Network
Below the banner, two cards show the traffic of this PC, one for the Internet and one for your local network. Each card shows:
- Download speed and Upload speed right now.
- Received 24h and Sent 24h: the data of the last 24 hours, as under Last 24 hours on the Statistics page.
- A live chart of about the last five minutes, with downloads and uploads in their traffic colors. The value at the top right of the chart shows its scale. Point at the chart to see both speeds at that second.
The Overview updates while its window is visible. It pauses while the window is minimized or hidden. For the connections behind the traffic, see Realtime.
Apps behind the chart
Click the chart to see which apps used the network around that moment. A panel opens on the right side of the window. Its title names the zone and the five-minute window that contains the moment you clicked, such as Internet · 11:30–11:35. It shows the data received and sent in that window and lists the apps that used the network, the busiest first.
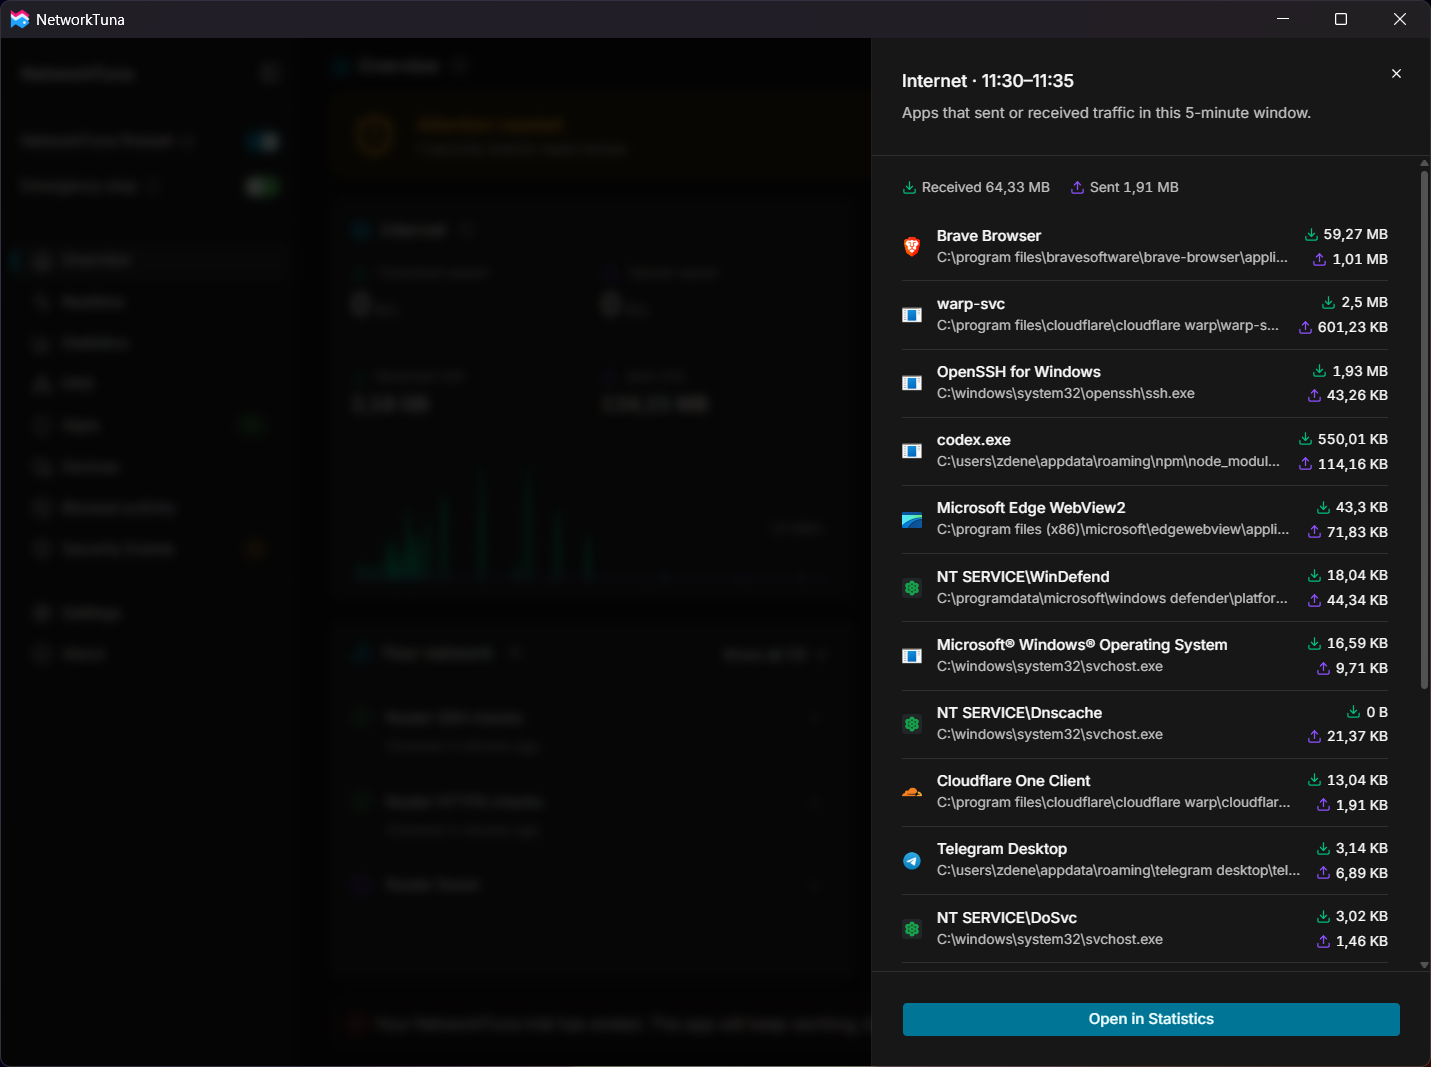
Open in Statistics opens the Statistics page for that hour, in five-minute steps, with the apps of the same zone.
Your network
The Your network panel at the bottom left shows the router checks and findings about your network:
- Router found: the router this PC uses. Click it to open the remembered routers.
- Router SSH checks and Router HTTPS checks, when router monitoring is on: whether the router's current keys match the remembered ones. Click a check to see the keys, and Router details for the router.
- Warnings about your network that wait for review, such as a changed router key or signs of ARP spoofing. See Local network changes.
When router monitoring is off, the panel says so. Click the row to open its settings. See Router checks on the Overview.
This computer
The This computer panel at the bottom right shows how this PC is protected and who contacted it:
- Watching for suspicious connection attempts: the detections of port scans and attempts to reach watched services are on. If some are off, the row says so and opens their settings.
- NetworkTuna firewall is active, or off. See App firewall.
- Findings that wait for review, such as A source tried many ports on this computer. See Port scan detection and Watched services.
- Services on this PC that other devices can reach, such as Remote access (SSH) or Remote Desktop (RDP): whether they are waiting for connections, have an incoming connection right now or had traffic recently.
- Apps that wait for a firewall decision.
A service name only says what the port is usually used for. An incoming connection does not prove that anyone signed in or started a remote session.
Colors and rows
A green row is a check that currently succeeds. An amber row is worth a look, such as a finding, an incoming connection or recent traffic on a service. After 48 hours, an amber row turns gray and moves down. A red row is a high-level alert. Other rows are information.
Each panel shows its most important rows first and never hides a warning or an alert. Show all at the top right of a panel lists every row with more details, such as remote addresses. Click a row to see what is behind it:
- A finding opens its event details, as on the Security Events page.
- A service opens its current connections. Open traffic history opens the Statistics page. When one app owns the connections, View incoming connections in Realtime shows that app's incoming connections.
- A row about a check that is off opens its settings.
Overview options
The ⋮ button at the top right of the page offers:
- Detection settings: opens Settings › Security › Detections.
- Compact page header: uses a smaller page header. The button next to ⋮ switches it too, and NetworkTuna remembers the choice.