Documentation menu
Statistics
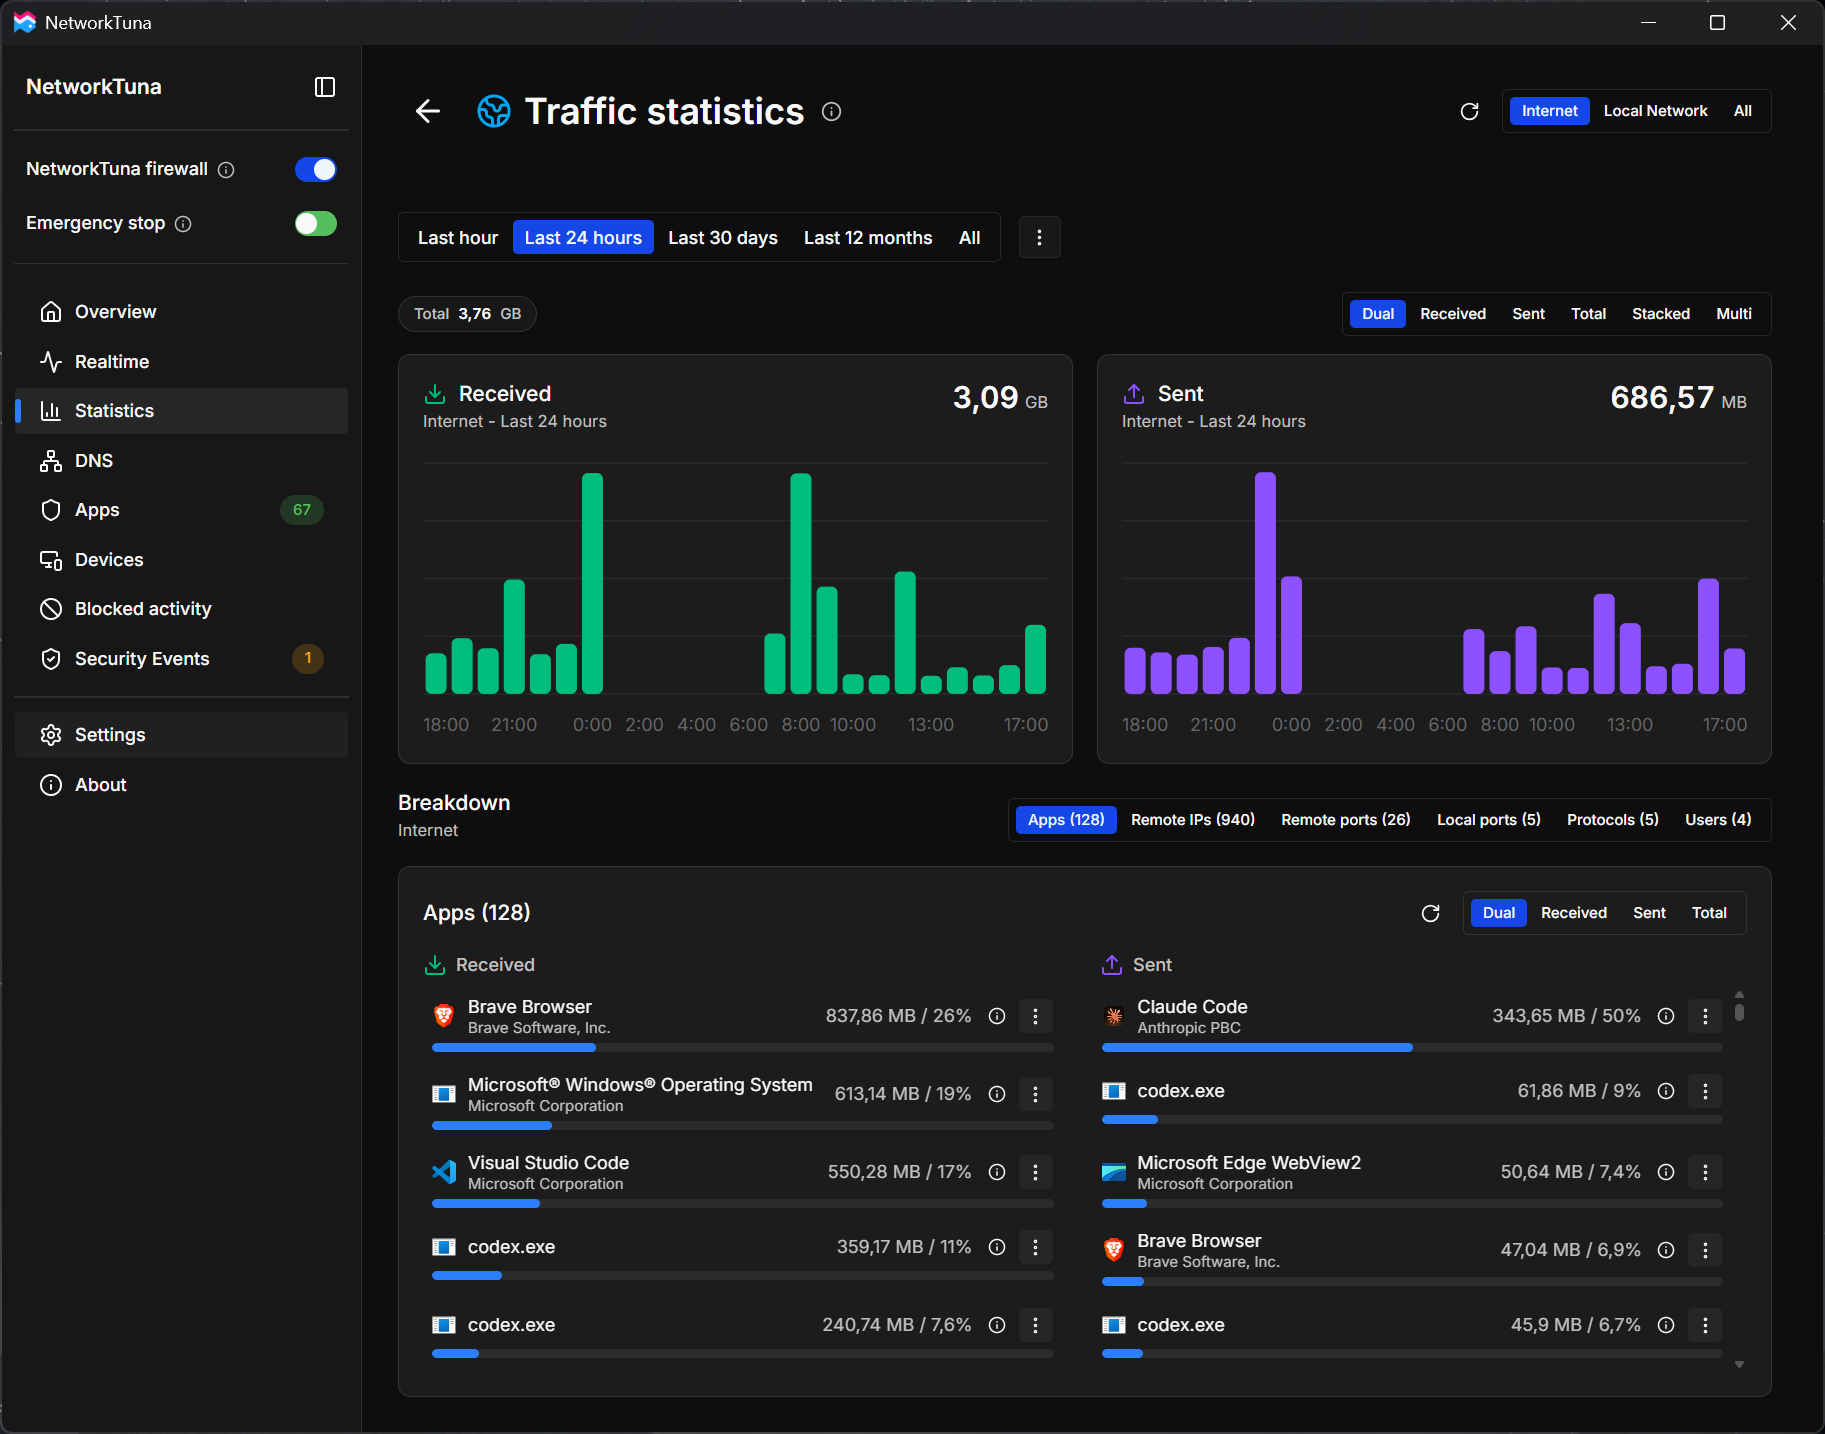
NetworkTuna measures the network traffic of this PC all the time and gives you two views of it:
- Right now: the Realtime page shows the traffic of this moment: which apps are connected, how fast they send and receive, and their open connections.
- History: NetworkTuna also saves the traffic to a history on this PC. The Statistics page shows it: how much data each app sent and received in the last hour, yesterday, last month or since you installed NetworkTuna.
To open the history, choose Statistics in the sidebar.
Realtime and history
| Realtime | Statistics | |
|---|---|---|
| Shows | Current rates, open connections and totals since the last reset | Traffic of a period, from the last hour to all time |
| Updates | Every 1, 2 or 5 seconds while the page is open | When you open the page or click the refresh button |
| Keeps | Totals until you reset them | The history, on this PC |
NetworkTuna records the history in the background, also while the NetworkTuna window is closed. It saves the history in five-minute steps. When you open Statistics or click the refresh button, the page includes the traffic up to that moment. It does not update by itself while you watch.
Reset totals on the Realtime page starts its totals again but does not change the history.
What NetworkTuna keeps
The history has two parts:
- Application traffic history: how much each app sent and received. NetworkTuna always keeps it.
- Connection details: the remote addresses, ports, protocols and Windows users of the traffic. They are kept by default and can use much more storage than the app totals.
NetworkTuna keeps the history on this PC and does not delete older history by itself. Removing a deleted app from the Apps page keeps its history too. Uninstalling NetworkTuna deletes the history only when you choose to delete all of its data.
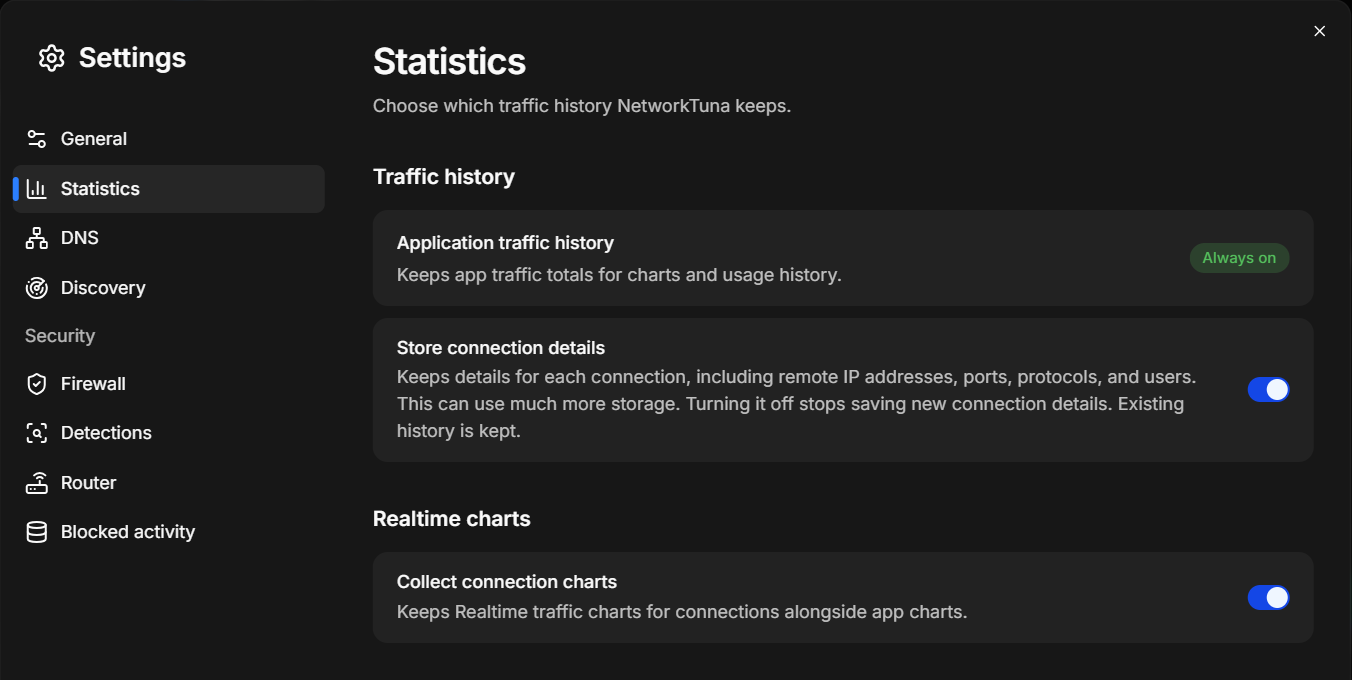
To stop saving connection details, turn off Store connection details in Settings › Statistics. The app totals continue, and the connection details saved so far stay available. The Statistics page then shows a note with a Statistics settings button that opens this setting. The same settings page has Collect connection charts, which keeps Realtime charts for single connections as well as for apps. It is off by default.
Time periods
The buttons at the top left of the page choose the period. Each bar in the charts covers a part of it:
| Period | Each bar |
|---|---|
| Last hour (the default) | 5 minutes |
| Last 24 hours | 1 hour |
| Last 30 days | 1 day |
| Last 12 months | 1 month |
| All | 1 year |
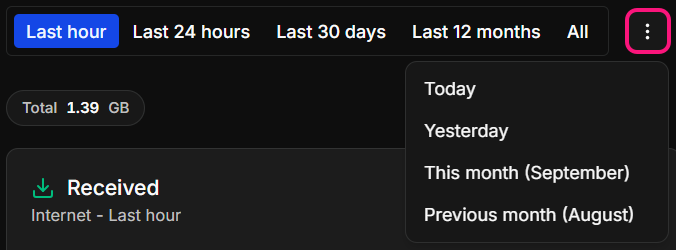
The ⋮ button next to them offers Today, Yesterday, This month and Previous month. A day shows one bar per hour, and a month one bar per day.
Dates, times, month names and numbers follow the regional format set in Windows. Some pictures on this page come from a PC with the Czech format, so they show dates such as 23. 9. 2026 and decimal commas.
Look closer at a period
Point at a bar to see its time range and how much data was received and sent in it.
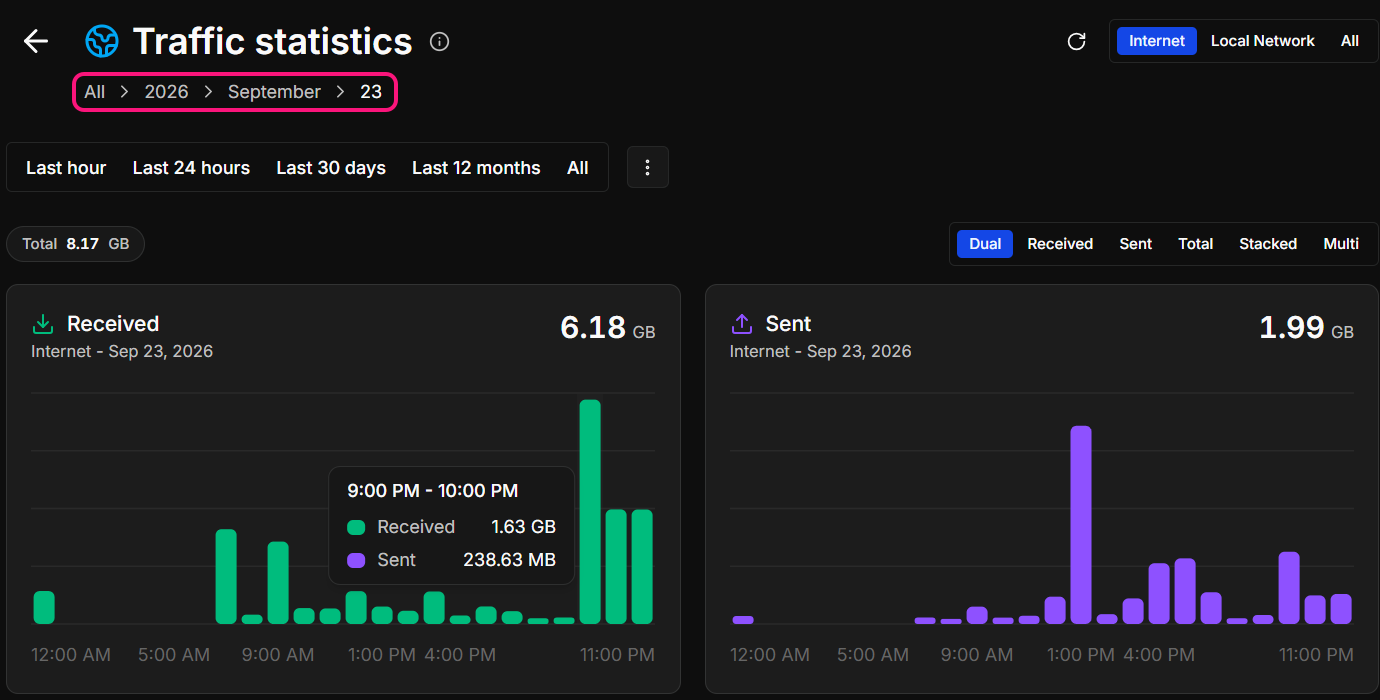
Click a bar to see its time in more detail. Under All, a bar opens its year. A year shows its months, a month its days, a day its hours, and an hour its five-minute steps. From Last 12 months, a bar opens its month, and from Last 30 days its day. From Last hour and Last 24 hours, a bar opens its hour.
Below the page title, a path such as All › 2026 › September › 28 shows where you are. Click a part of it to go back to that level. The arrow at the left of the page title goes back one step.
Traffic zones
Use the zone switch at the top right of the page to choose which traffic you see:
- Internet: traffic to and from the Internet. This is the default.
- Local Network: traffic within your local network.
- All: both.

The refresh button next to the zone switch loads the history again, including the latest traffic. Traffic between apps within this PC is not counted.
Charts
The Total at the top left, above the charts, is everything received and sent in the chosen zone and period. The switch at the right chooses how the charts show it:
| Chart | What it shows |
|---|---|
| Dual | Two charts, Received and Sent, side by side. This is the default. |
| Received | Only received data |
| Sent | Only sent data |
| Total | Received and sent data added together |
| Stacked | One chart with sent data on top of received data |
| Multi | One chart with received and sent data next to each other |
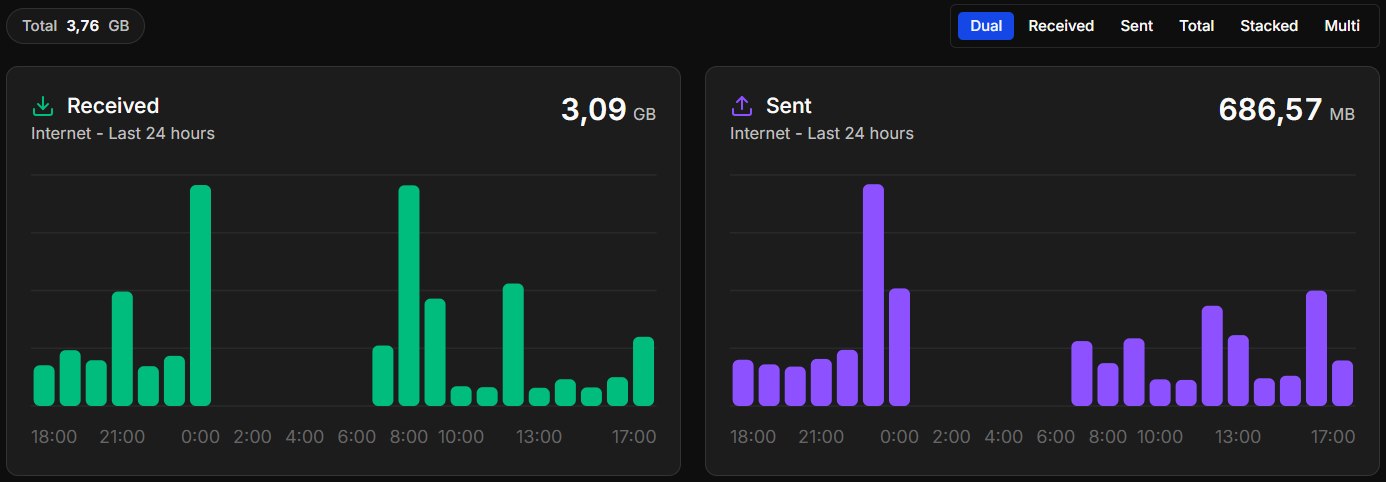
Below its title, each chart names the zone and period. Its total is at its top right. To choose the units (such as MB or Mbit) and the colors of received and sent traffic, open Settings › General.
Breakdown
Below the charts, Breakdown shows what the traffic consisted of. The switch at the right of the Breakdown heading chooses the list. The number in each button is the number of entries in the chosen zone and period.
| List | What it lists |
|---|---|
| Apps | The apps that used the network |
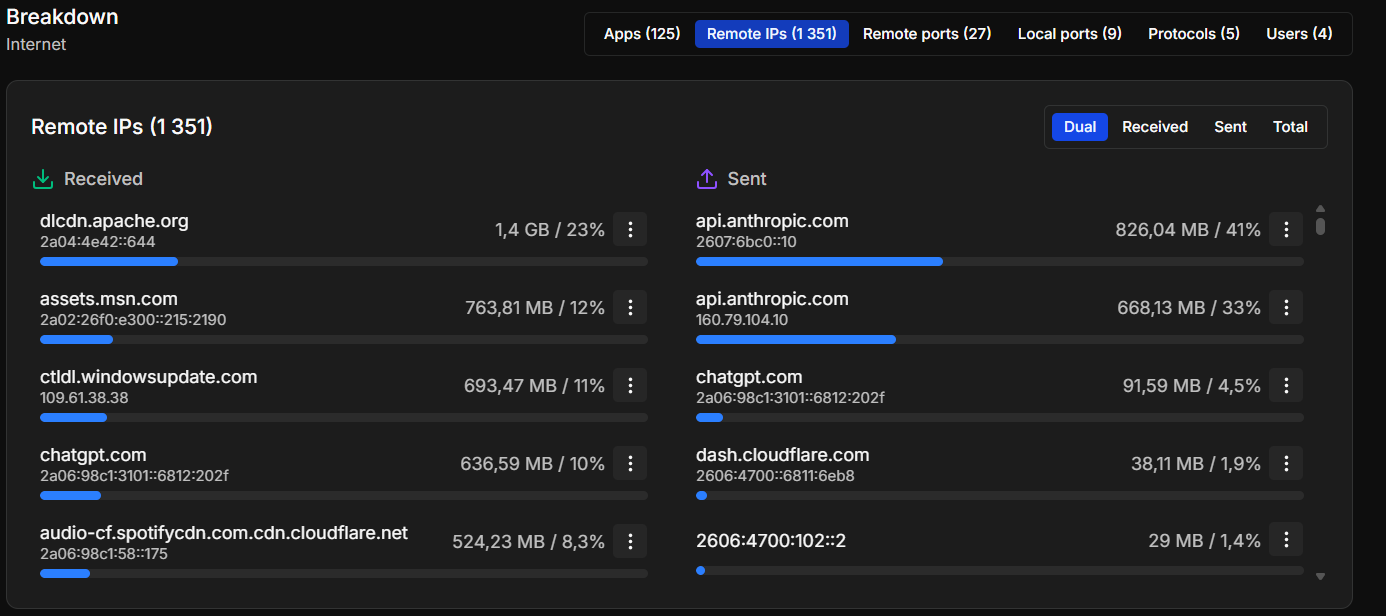
| Remote IPs | The addresses of the other side, with domain names where NetworkTuna knows them |
| Remote ports | The ports on the other side, such as 443 for HTTPS |
| Local ports | The ports on this PC |
| Protocols | Such as TCP, UDP and ICMP |
| Users | The Windows user accounts the traffic belongs to |
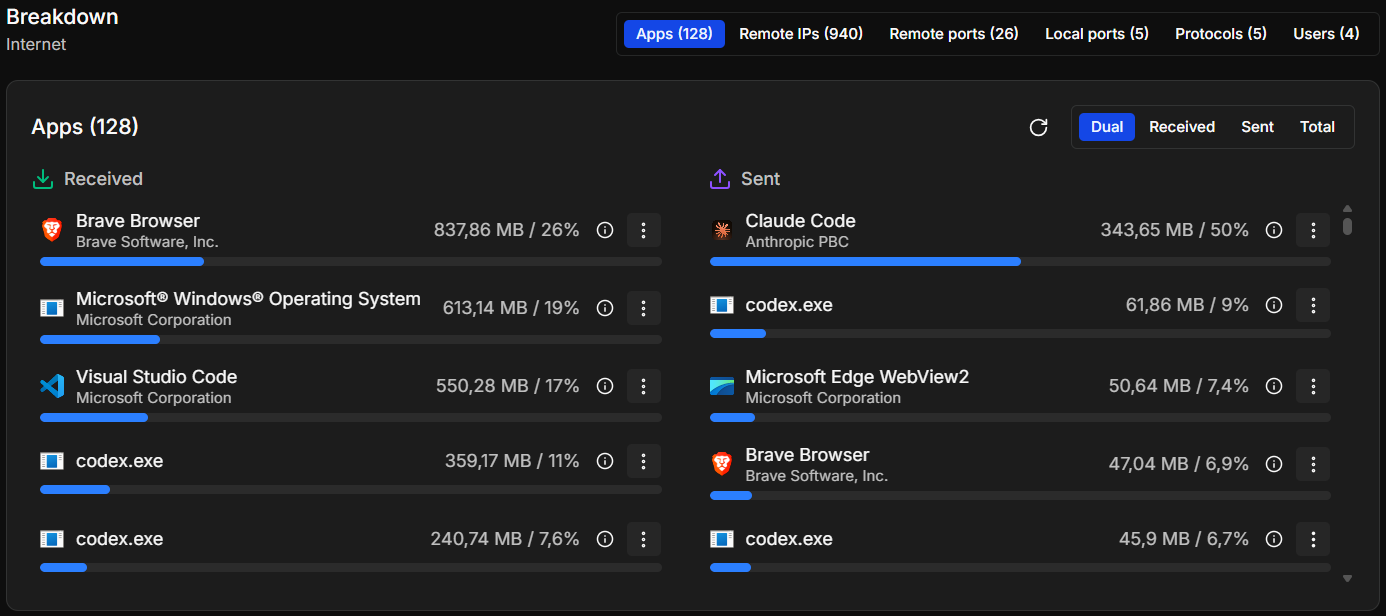
Each row shows the amount of data and its share of the total, and the bar under it shows the same share. The switch at the top right of the list chooses what the list counts: Dual shows received and sent data in two lists side by side, which is the default. Received, Sent and Total show one list.
All lists except Apps come from the connection details.
In the Remote IPs list, NetworkTuna shows a domain name above the address when it knows one, collected the same way as on the Realtime page. Point at a row to see every name of the address.
App actions
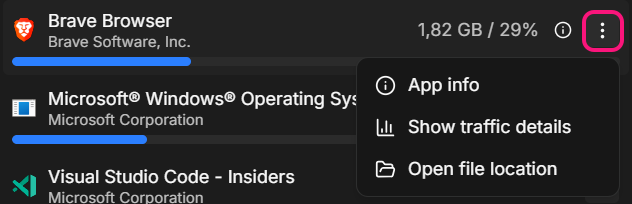
In the Apps list, the ⓘ button of a row opens the app details window. The ⋮ button next to it opens the app actions:
- App info opens the app details window.
- Show traffic details opens the traffic details of the app.
- Open file location opens the app's folder in File Explorer.
Right-click a row for the same actions. The rows of the other lists offer Show traffic details. The refresh button above the Apps list reloads the names and icons of the apps.
Show the traffic of one app, address or port
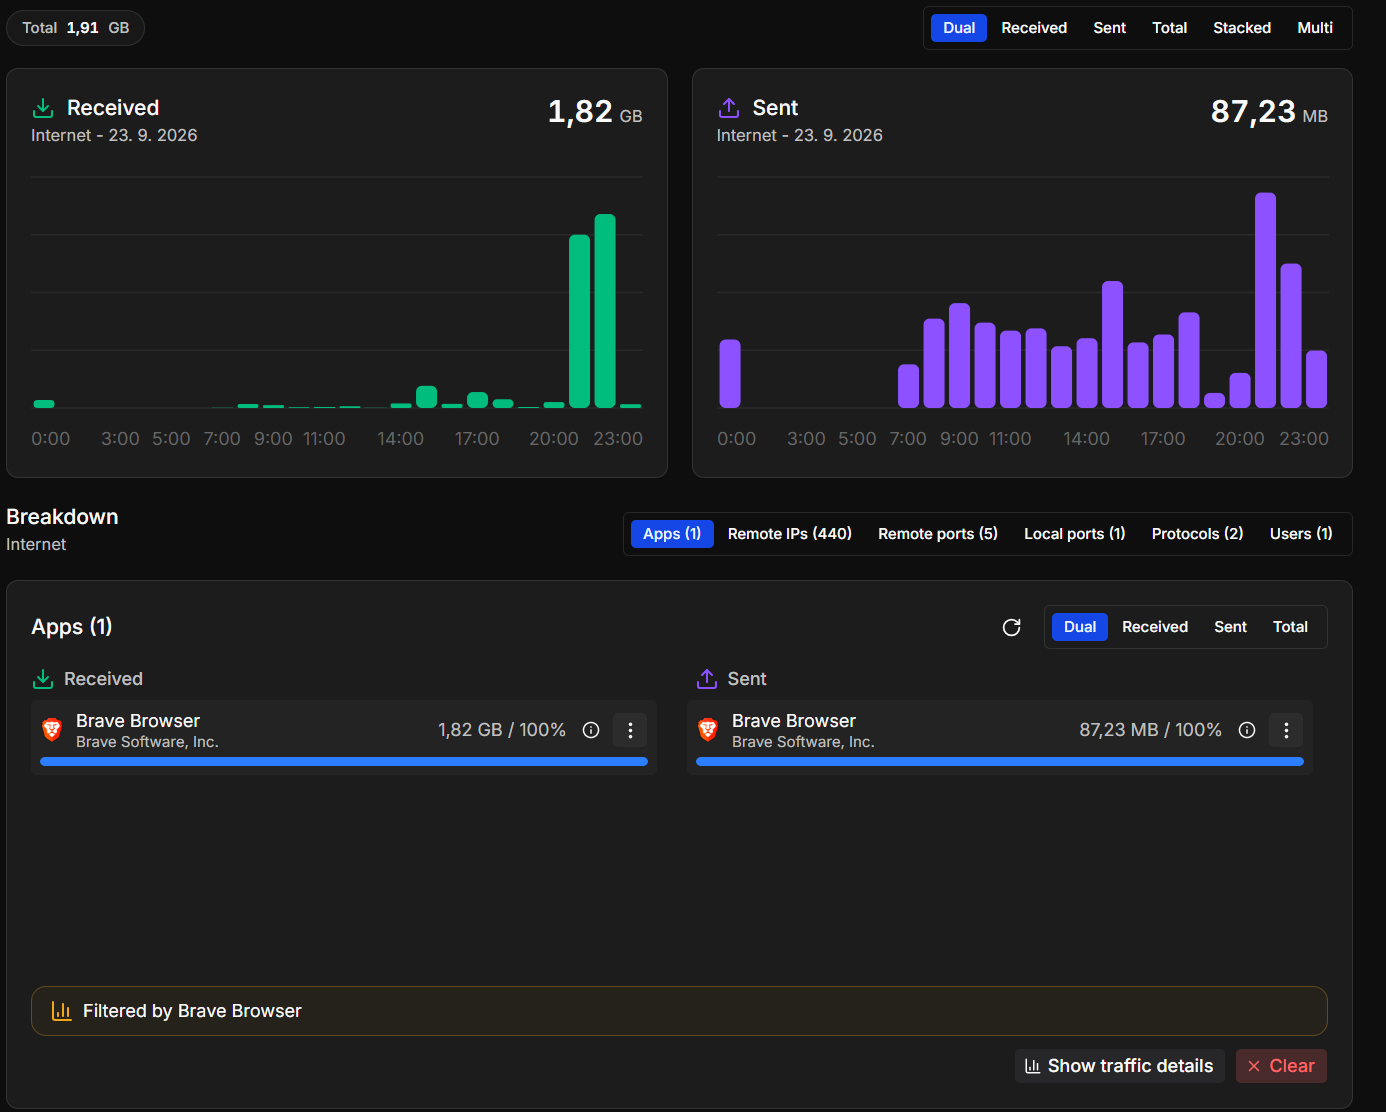
Click a row in a Breakdown list to see only its traffic. The Total, the charts and every Breakdown list then show only the traffic of that app, address, port, protocol or user. For example, click an address in Remote IPs and switch to Apps to see which apps sent data to it, or click an app and switch to Remote IPs to see where it connected.
Below the list, Filtered by names the row you chose. Show traffic details opens its traffic details, and so does a second click on the row. Clear shows all traffic again.
This view uses the connection details, so it covers only the time when Store connection details was on.
Traffic details
Traffic details lists the connections behind an app, address, port, protocol or user, for the same zone and period. Below the page title, it names what it shows. The arrow at the left of the title returns to Statistics. For an app, the ⓘ button at the top right of the page opens the app details window.
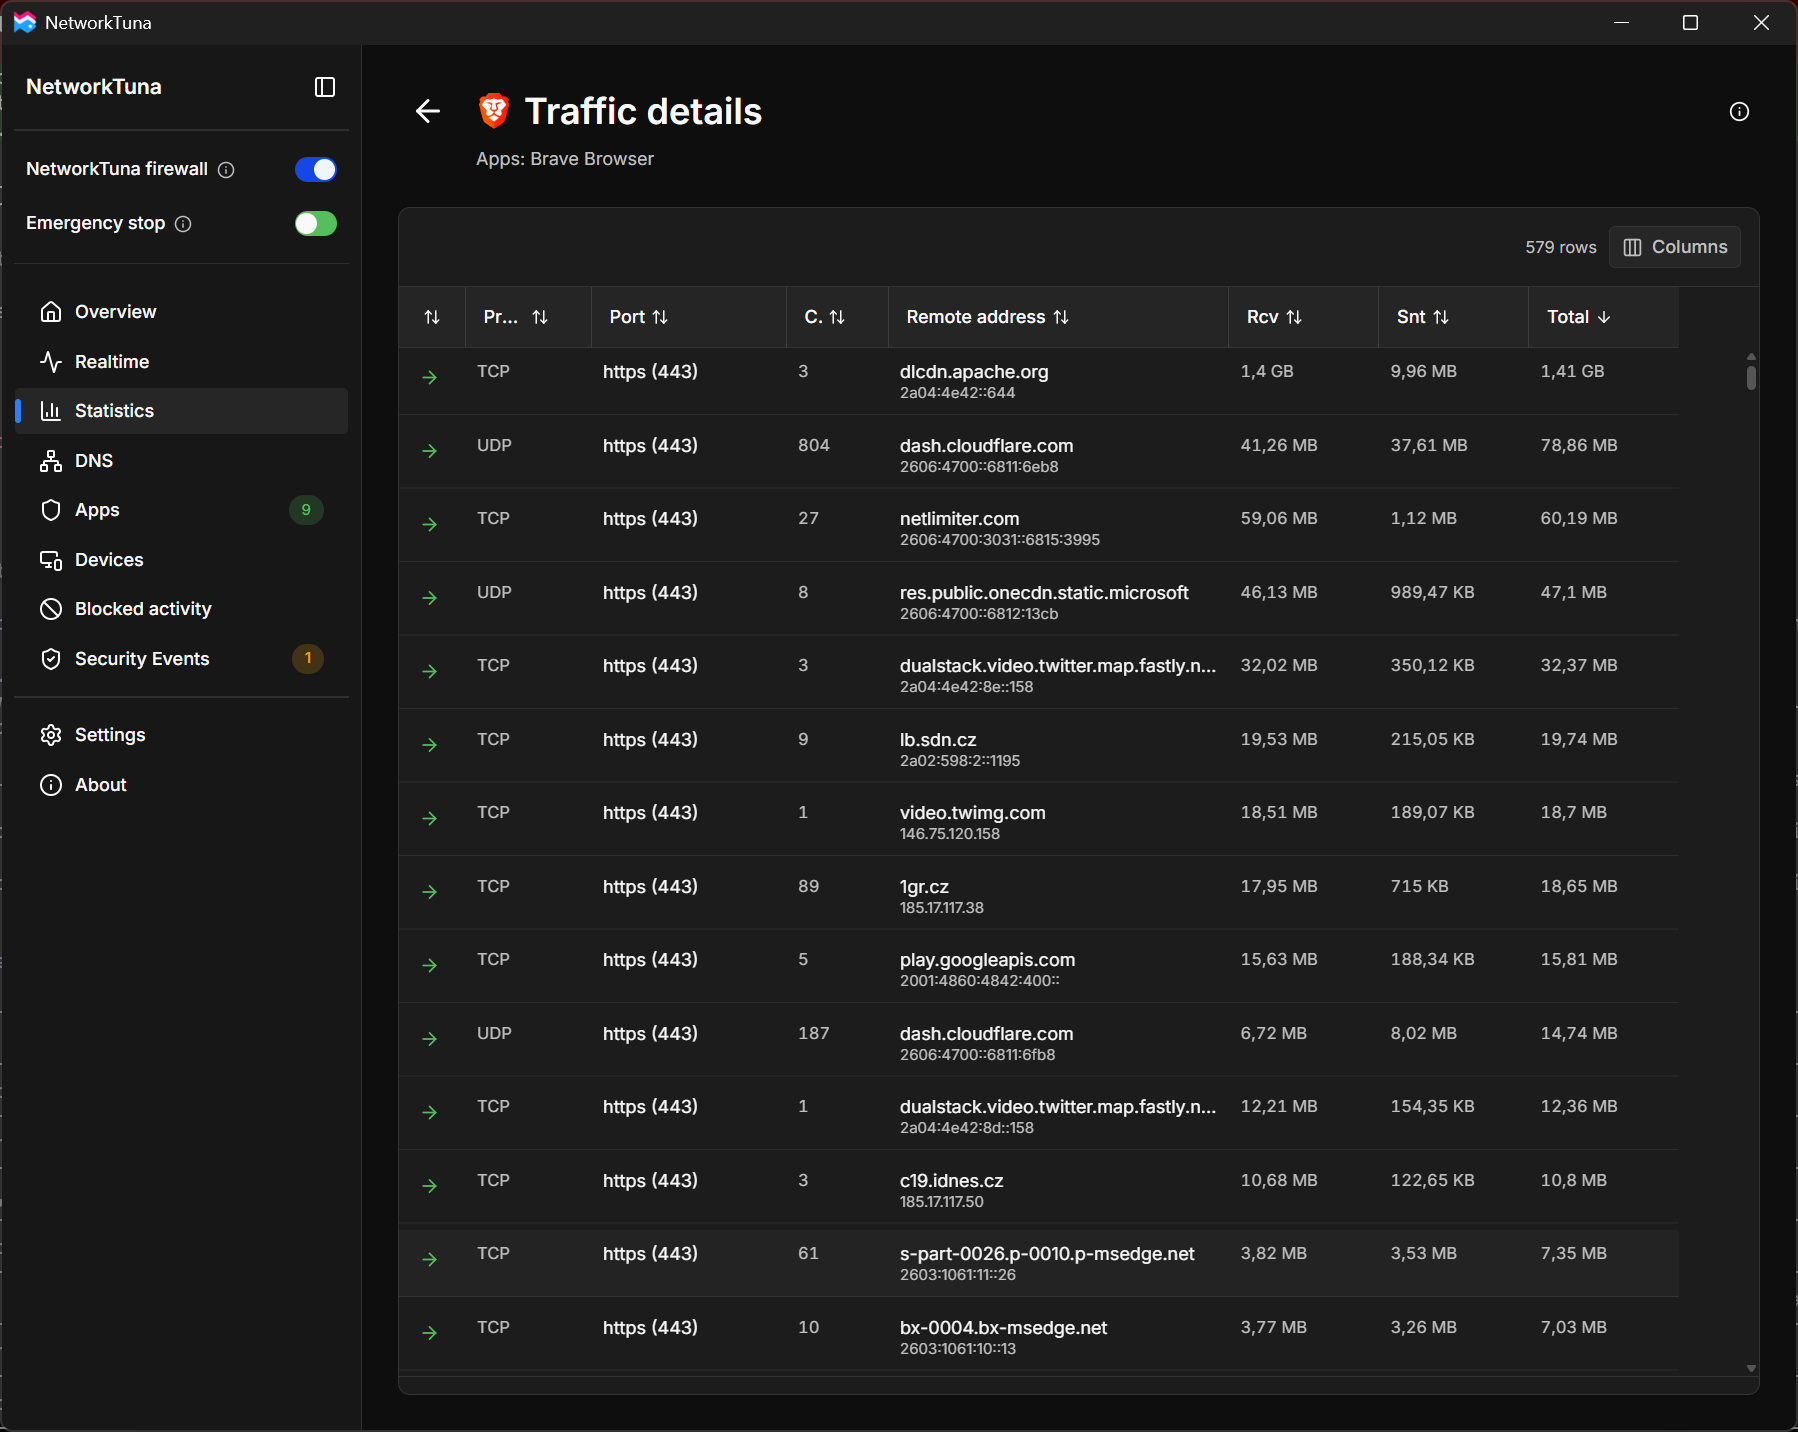
Each row groups the connections that share the same app, direction, protocol, port and addresses:
| Column | Description |
|---|---|
| Direction | An arrow for incoming or outgoing |
| App | The app. Hidden when the page shows the traffic of one app. |
| Protocol | Such as TCP or UDP |
| Port | The port and its service, such as https (443) |
| Connection count | How many connections the row groups |
| Remote address | The other side, with its domain name above the address where NetworkTuna knows it |
| Received, Sent, Total | Data received, sent and both together (Rcv, Snt and Total) |
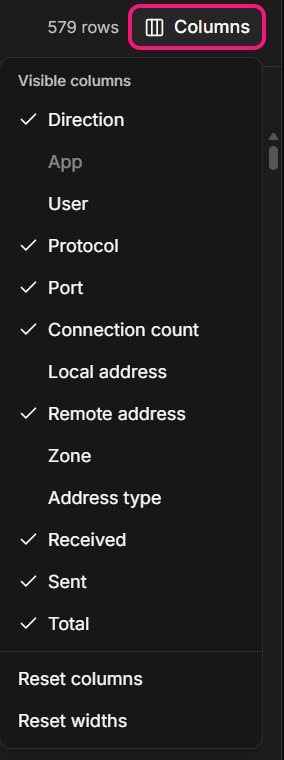
Narrow columns shorten their headings, such as C. for Connection count. The rows start with the most data. Click a column heading to sort by it. The Columns button at the top right of the table shows more columns, such as User, Local address, Zone and Address type. Reset columns and Reset widths in the same menu restore the default.
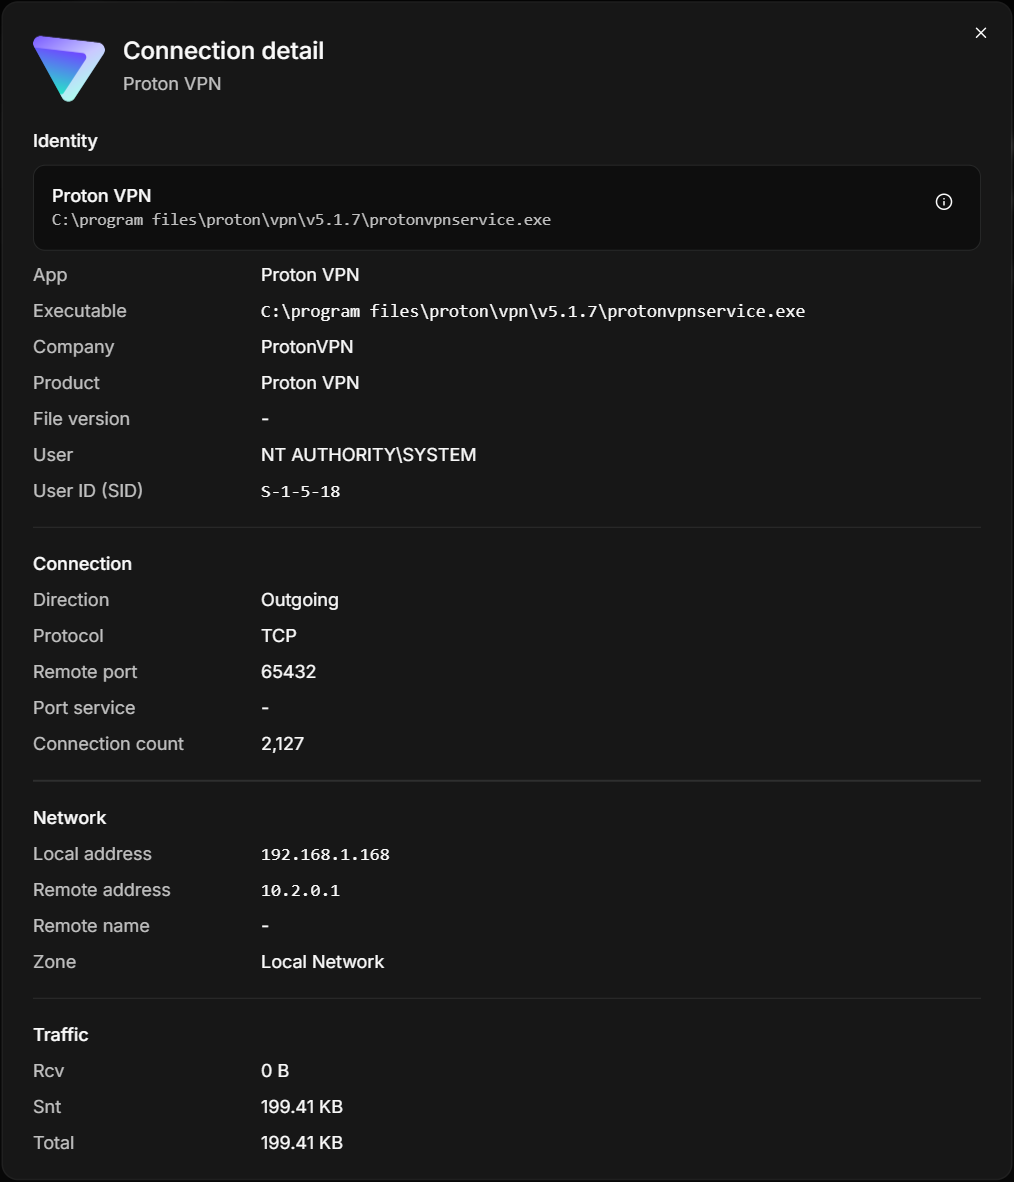
Click a row to open its Connection detail window: the app and its Windows user, the direction, protocol, port and its service, the number of connections, the local and remote addresses with the remote name and zone, and the data received and sent.