
Documentation menu
Realtime
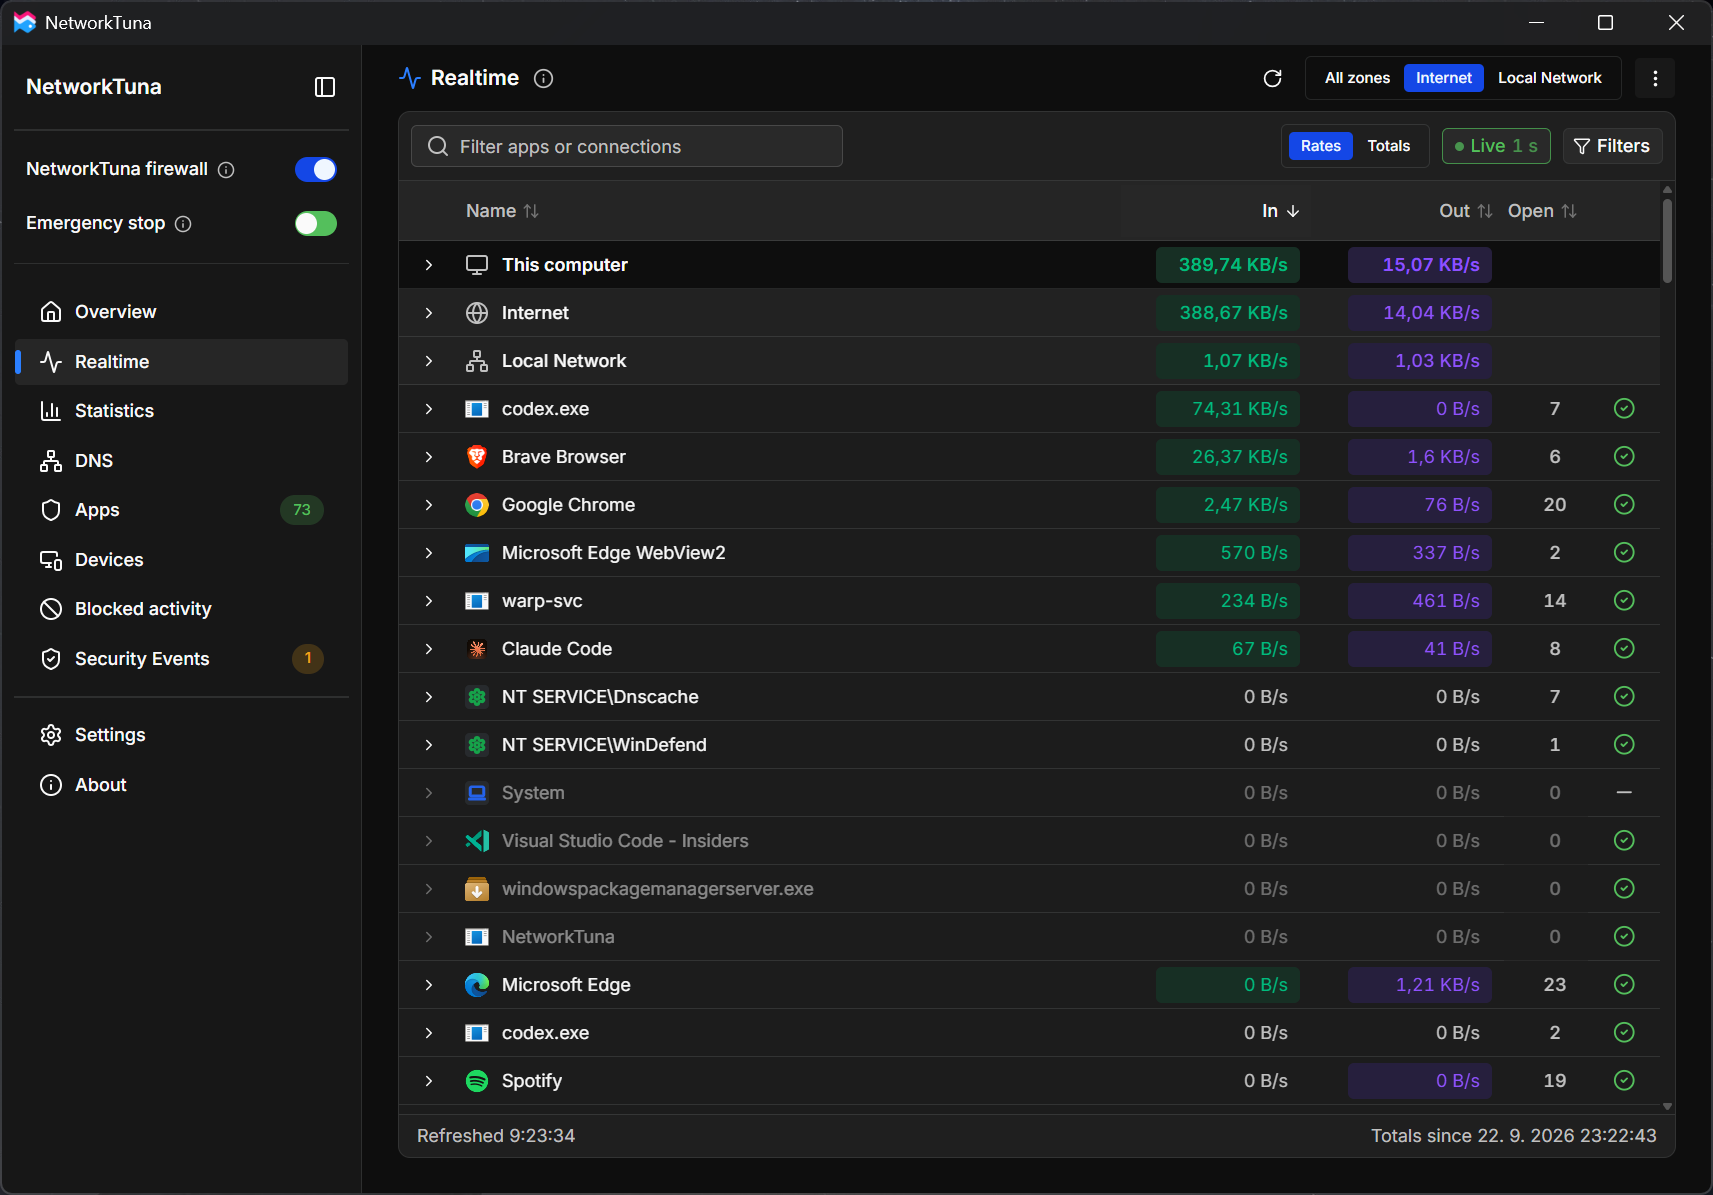
The Realtime page shows current app and connection traffic: which apps are connected right now, how much data they send and receive, and where they connect. To open it, choose Realtime in the sidebar.
Traffic zones
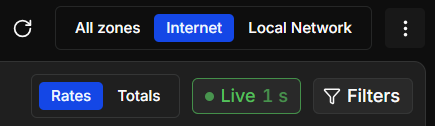
Use the zone switch at the top right of the page to choose which traffic you see:
- All zones: all traffic.
- Internet: traffic to and from the Internet.
- Local Network: traffic within your local network.
Each session starts with All zones.
The app list
| Column | Description |
|---|---|
| Name | The app |
| In | Data received |
| Out | Data sent |
| Open | The number of open connections |
The last column shows the app's firewall setting.
The This computer, Internet and Local Network rows at the top summarize all traffic. The zone switch, search, filters and sorting do not change them. Click one of them to open its details panel, or its arrow to see the connections of every app in that scope.
Apps that have exited keep their totals until you reset them.
Rates and totals
Rates and Totals in the toolbar switch between current rates and totals. Totals count from the time shown in the page footer.
To start counting again, open the Realtime options with the ⋮ button at the top right of the page and choose Reset totals. This resets the totals of apps, connections and the whole computer in both zones. Stored history, charts and firewall settings are kept.
Search and filters
Type in the search box at the top left of the list to filter apps and connections by name, address, app path or process ID.
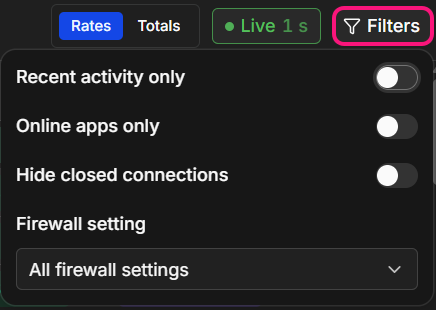
The Filters button at the right end of the toolbar offers:
- Recent activity only
- Online apps only
- Hide closed connections
- Firewall setting: Allow, Ask, Block or None
Connections
To see an app's connections, click the arrow at the left of its row, or Show connections in its details panel. Back at the top left returns to the app list.
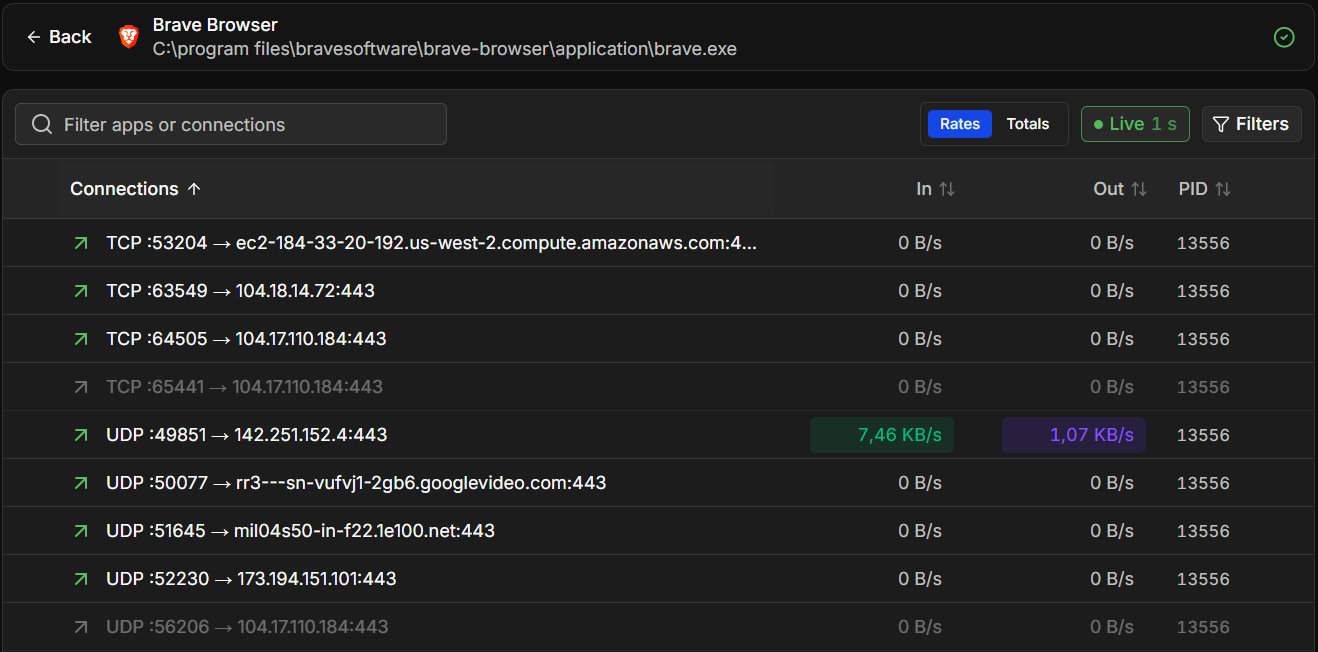
Each connection shows its direction, protocol, local port and remote address, traffic in and out, and the process ID. The arrows of the This computer, Internet and Local Network rows list the connections of every app in that scope, with an extra column for the app.
When NetworkTuna knows a domain name for the remote address, it shows the name instead of the address. Point at a connection to see its exact addresses and every name. NetworkTuna collects the names from the DNS lookups Windows makes on this PC. Use Windows DNS lookups in Settings › DNS turns this on or off. A name that comes only from reverse DNS is marked: whoever controls the address chose that name, so it does not prove who runs the server.
App and connection details
Click an app, a connection, or one of the This computer, Internet and Local Network rows to open its details panel on the right side of the page.
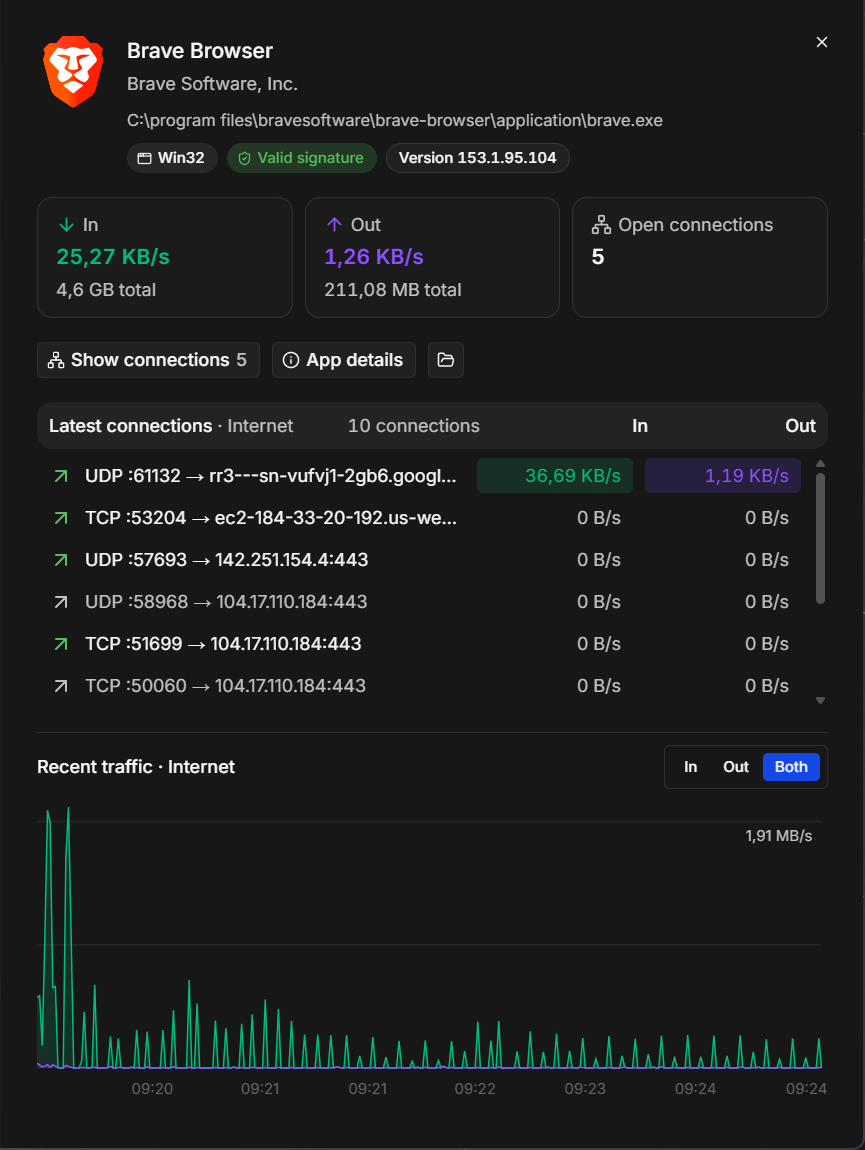
The panel of an app shows:
- the current In and Out rates with totals, and the number of Open connections,
- the app's type, signature and file version,
- Latest connections: up to 50 connections that most recently sent, received or opened, busiest first, including closed ones. Click one to see its details. When there are more, Show all connections opens the full list.
- Recent traffic, a chart of the app's traffic. In, Out and Both above the chart choose which direction it shows.
Show connections lists all of the app's connections, App details opens the app details window, and the folder button opens the app's folder in File Explorer. The panels of This computer, Internet and Local Network show the traffic, latest connections and chart of all apps together.
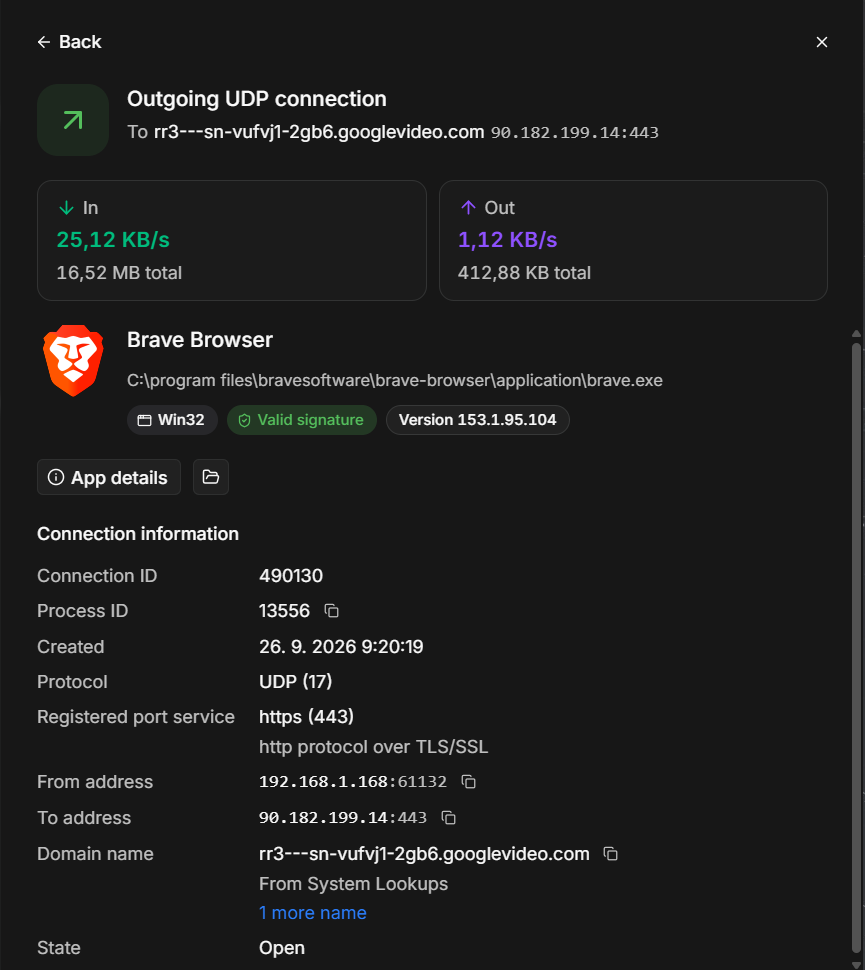
The panel of a connection shows its direction, protocol, addresses, domain name, process ID and state, and the app it belongs to. When several sites share the remote address, it lists their names too, because the connection may belong to any of them. Back at the top returns to where you came from.
Changing firewall access
You can change an app's firewall setting directly from the Realtime page: click the firewall icon at the right end of the app's row, or of the bar above its connections, and choose Allow, Ask or Block. The setting applies to the app in both zones, not only to the selected connection. See App firewall.
Realtime options
Open the Realtime options with the ⋮ button at the top right of the page.
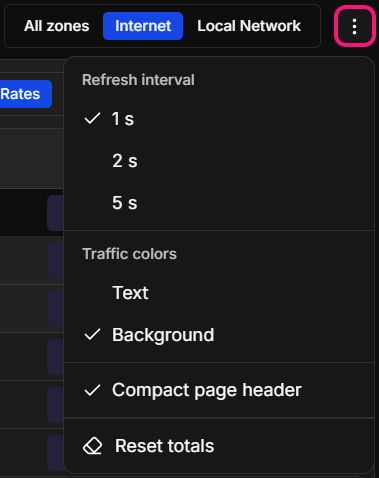
| Option | Description |
|---|---|
| Refresh interval | 1, 2 or 5 seconds. The default is 2 seconds. |
| Traffic colors | Colors traffic values as text or as a background |
| Compact page header | Uses a smaller page header |
| Reset totals | Starts counting totals again |
Live in the toolbar means that the page refreshes automatically. Click it to switch to Manual and refresh the page yourself with the refresh button next to the zone switch. The page pauses while the NetworkTuna window is minimized or hidden.